


A Complete Guide To Instagram Analytics
Instagram is used by over one billion people worldwide, with new users spending an average of 29 minutes a day scrolling through the app.
![]()
The figures speak for themselves. There are plenty of ways to reach out to the target market. Cutting through the noise, driving interaction, and converting your followers into loyal customers are the challenges. Your hidden weapon is Instagram analytics, or Insights, as the app calls it. You can use Insights to make data-backed decisions that optimize your Instagram strategy and increase ROI if you take a constructive and educated approach.
This is your all-in-one Instagram analytics resource. Learn how to use Insights, what the various metrics mean, and, most importantly, how to operate on the information at your fingertips. The massive Instagram analytics guide for 2021 is below.
What are the benefits of Instagram analytics?
Assume you’re on a road trip in a foreign country. You’re in a hurry to get to your next destination. Are you a fan of:
- Using a map as a guide?
- Why not take a chance and hope for the best?
Option 1 was most likely your first option, and with solid reason. Without a map (or Siri), navigating around unfamiliar terrain is a formula for missed dinner reservations and frantic phone conversations with your hotel manager.
Now, let’s return to Instagram. Consider your Instagram target as a destination. To get there, you’ll need a map, and Instagram analytics is just that. It tells you who your audience is, what kind of content they like, and even when they are most interested. If you use this information to shape your Instagram plan, you’ll be well on your way to achieving your objectives. There are a few limitations, however.
First and foremost, Instagram analytics are only useful if you know what you want to do with the platform. If you don’t know where you want to go, a map is almost useless. So, before you start putting Instagram analytics to use, make sure you know what you want to achieve. If you want to boost the brand’s visibility? Are you looking to expand your target audience? Do you want to rebrand your company? Or do you want to sell more stuff?
You could have a single straightforward goal or many. In any case, spend some time imagining what Instagram success would look like for you and your business. Second, Instagram analytics are only useful if you let the numbers form your content plan in a subtle way. Don’t turn right if Siri tells you to turn left! However, if you come across a stunning view, it’s perfectly appropriate to pull over and take in the scenery.
Remember that you (probably) aren’t your target audience, so don’t let your personal tastes dictate the type of content your company produces. Listen to the data, trust it, and let it guide your strategy, but leave space for chance.
1. How to Look at Instagram Stats
To access Instagram analytics, you must have a company or creator profile. Check out our guidelines here if you haven’t already made the move. Aside from Insights, business profiles have a slew of other features.
Otherwise, you’re poised to plunge into the fascinating realm of Insights. Simply go to your profile and press the burger menu icon in the top-right corner. Insights from a variety of sources.
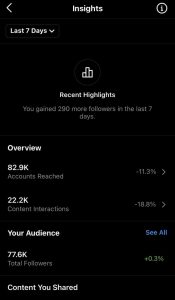
When you first open Insights, you’ll be bombarded with data and metrics from the previous seven days – here’s how it works:
- Recent highlights
1. Below this header, you’ll see the number of followers you gained or lost over the last seven days
- Overview
1. Content interactions
2. Accounts reached
- Your audience
1. Total followers
- Content you shared
1. Number of posts
2. Number of IGTV videos
3. Promotions
4. Number of Stories
A brief note: If you’ve recently switched to an industry or creator profile, you won’t see any analytics for content that was previously released. Instagram can only provide you with information about content published by businesses or creators. You can dig even deeper by tapping on any of the parts mentioned above. You can change the seven-day time period to 30-days in the top-left corner if you like. You can also get post-specific metrics by clicking on a post in your grid and choosing “View Insights” to the left of the big “Promote” icon, right below the picture.
The following metrics will be shown as a result of this:
- Comments
- Likes
- Profile visits from the post
- Reach
- Shares
- Saves
- Profile visits or, whether it’s a supported post with a reference, clicks are examples of interactions.
- Discovery, which provides information about how many people are viewing your content and where they are viewing it:
1. Total reach
2. Accounts reached
3. Fresh follows
4. Percent of accounts approached that weren’t following your account
5. Impressions and where they occurred: at home, in the city, etc. hashtags, and other stuff to look at.
9. Promotions
Finally, if you’re using Insights on the go and need some help, there’s a fast and simple Instagram analytics guide built right into the app. In the top-right corner of your screen, tap the information icon (which looks like an italicized ‘i’)
That’s what there is to it. Now for the specifics.
b. Analytics
1. Instagram analytics: Interactions with content
What exactly is it?
The number of times your followers and other Instagram users interacted with your posts is referred to as content interactions. These stats track how people respond to posts, Stories, IGTV videos, and Reels.

What can you see?
To begin, you’ll see the total number of interactions for the selected time span. After that, you’ll see a percentage that compares the current period’s interactions to the previous period’s interactions.
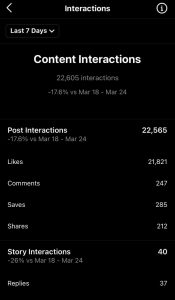
The total number of post interactions is then shown, followed by a breakdown of different interaction types:
- Comments
- Shares
- Likes
- Saves
Then there’s Stories. The total number of Story interactions, as well as the number of responses and shares, will be shown. The total number of IGTV video interactions would then appear. Finally, based on interactions, you’ll see your most popular posts, Stories, and IGTVs. To see all of your content organized by interaction, tap “See All” beside each heading.
Why does it matter?
If reach is a metric of quantity, interactions are a metric of quality. What good is it if your posts hit 10 million people if they aren’t interacting with your content? Since engagement is what unlocks Instagram’s full potential, tracking interactions should be a mainstay in your ongoing content optimization strategy.
Instagram marketing is about creating a real bond with your audience, which necessitates communication. It’s called social media for a reason. It may be a literal conversation – promoting and responding to user comments – or a metaphorical conversation – constructive feedback in the form of likes.
- Try out various types of posts and monitor your results. Is it more engaging for your audience to view images or videos, for example?
- Organize the imagery into categories and see what exactly resonates. Is there a correlation between scenery and likes? It’s possible that pictures of your squad, before and afters or inspirational quotes are the most effective. Pay attention to the colors as well.
- Experiment with the captions. Is it true that using questions, prompts, and other call-to-actions boosts engagement? Is it easier to use short or long captions to launch a discussion in the comments section?
- Experiment with adding text to your Stories. Is it true that asking questions leads to more responses?
The more you pay attention to your interaction metrics, the more you’ll be able to improve your content’s engagement. The more interaction you can get, the more real, revenue-generating value you can extract from Instagram.
2) Accounts hit on Instagram
What exactly is it?
Accounts reached displays the number of specific Instagram accounts that your content has reached in the last seven or thirty days, depending on the time span you choose. Please remember that this is not the same as impressions; one account may see your post five times, resulting in a +1 for accounts reached and a +5 for impressions.
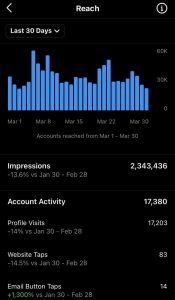
What you’ll notice
First, you’ll see the cumulative amount of Instagram accounts you’ve hit for the time span you’ve chosen. The ratio below compares the current period’s results to the previous period’s performance. Then you’ll see a graphic showing how many accounts were reached per day. Even if you post every day, your scope would most likely fluctuate dramatically from day to day.
The number of impressions and the percentage change from the previous period are shown below the graph. Notice how the number of impressions is slightly higher than the number of accounts managed to reach? The profile in the screenshot above has about ten times the number of impressions as the number of accounts reached, indicating that each user is seeing published content ten times. The next step is to look at your account behavior. These statistics are based on the behavior that occurred on your account, not on interaction with your content.
The following is what you’ll see:
- Visits to profiles
- Website taps, if you have a link to your website (or some other link) in your bio.
- If you have your address specified in your bio, you can get directions taps.
- Taps on the call button if your phone number is specified in your bio.
- Taps on the email button if your email address is mentioned in your bio.
- Taps on the text button if you’ve set up this feature with your phone number
Finally, based on reach, you’ll be able to see your most popular posts, Stories, and IGTV videos. To view all of your content organized by reach, tap “See All” next to each heading. This segment will be skipped. If you can’t wait, scroll down to the Content you posted.
Why does it matter?
Reach is an important metric to track because it can assist you in answering some of Instagram’s most challenging questions:
-Which content categories are the most common among your target audience?
-The types of content are most likely to elicit a response from your target audience?
-How do you get more customers to see your brand’s content?
Here’s where you can look for answers.
Which content types are the most common among your target audience?
The graph enables you to easily identify events that resulted in an increase in reach. If your reach increases every Saturday, for example, you can conclude that your target audience is more engaged (or more likely to engage) on Saturdays. If you tried sharing user-generated content on Tuesday, wait until Monday to see how this new strategy affected reach – did you experience an increase, drop, or median reach?
Although it’s not a scientific formula, you can presume that more interaction means more reach. Instagram uses engagement to determine if the content is important, meaningful, or enjoyable – people like it, and Instagram wants people to have a good time. As a result, the site exposes the content to a larger audience, and its reach.
What kinds of content are most likely to get your potential audience to take action?
While you can’t include a clickable link in your organic Instagram posts, you can convert your followers in a variety of ways. The account activity segment will assist you in developing a plan that effectively increases Instagram browsers.
Let’s say you want to increase the number of Instagram users who visit your website. For one week, you try adding “Click the connection in bio to learn more” to the captions of your articles. You can now check the account activity section to see if this call-to-action affected your followers’ actions.
How can you get more customers to see your brand’s content?
Most Instagram businesses want their posts to reach as many people as possible. The easiest way to figure out how to make the target a possibility is to use reach.
To begin, choose a reach strategy that fits your brand, such as:
-Playing around with common hashtags
-Use tags in your posts to identify individuals or brands
-Use questions in your captions to encourage interaction (and thus reach).
Then, for one week, try out the plan. Re-evaluate your drawn conclusions. If reach is higher than it was the previous time, your experiment might have been a success.
3) Instagram analytics: Who is your target audience?
What exactly is it?
Audience insights track follower growth and give you a detailed overview of your followers’ demographics, such as their location, age, gender, and peak activity times.
What can you see?
To begin, you’ll see your total number of followers as well as the percentage change in your follower count over the selected time span.
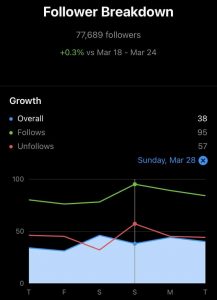
Then you’ll see a rundown of your account’s progression, including total growth, number of followers, and unfollows. These figures are shown graphically in the graph below. To see the follow and unfollow metrics plotted, tap the graph. The top positions of your followers will appear next. You will look at the top cities or nations.
Following that, you’ll see the age ranges of your followers reflected as a percentage of your total followers. You will see the general age averages as well as men’s and women’s age ranges. Then you’ll see a pie chart with the gender split of your followers.
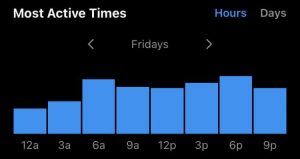
Finally, you’ll see when your followers are the most involved. You can choose between “Hours” and “Days.”
Why does it matter?
Starting with the growth metrics, here’s how you can integrate each part of your audience insights into your Instagram strategy.
Metrics of growth
Overall growth is a massive optimization tool that can help you figure out what’s working and what isn’t with your account. Check how changes to your content plan affect your growth rate when you tweak it. If you start using Instagram Reels and see a huge increase in new followers, you know your Reels content is valuable and engaging. This data can be used to further your future plan.
A short note: Instagram does not show you your account’s progress over periods longer than 30 days, so you may want to keep track of it in a spreadsheet.
Demographics of the target audience
The more you know about your target audience, the more you’ll be able to build content that appeals to them. You may use the demographics of your organic followers to guide your promotion strategies. For example, if the majority of your followers are women between the ages of 25 and 34, you don’t want to spend your advertising budget on men between the ages of 45 and 54.
Demographic measurements from Instagram may be applied to other marketing platforms as well. If your brand is already doing well on Instagram, demographics from your audience can be used to notify Facebook advertising, email promotions, and networking strategies. It’s worth noting that demographics like these can lead to a one-dimensional view of your ideal customers. It’s a good start to know how old they are and where they live, but it’s also worth extrapolating to get a more detailed image.
What does the fact that your audience is in their mid-twenties tell you about their values? What is it that drives them? What is it that they are concerned about? Construct three-dimensional personas with wishes, expectations, and challenges using demographics, and consider how your product or service satisfies their desires, meets their needs consistently, and overcomes their hurdles.
When are the most effective times?
One of the fastest wins in this Instagram analytics guide is using your audience’s most successful times to optimize your posting strategy. It’s easy and almost foolproof. When your Instagram followers are involved, publishing content increases the chances of your photos, Stories, IGTV videos, and Reels being viewed and interacted with. More engagement increases your reach, which means more brand awareness and performance levels.
Also, think about how content and time interact; imagine what your audience is doing when scrolling through Instagram. They are unlikely to react favorably to demanding or corporate-style material if it is 6.00 a.m. on a Monday morning and they are sitting on a crowded train tired. They want things to be easy. They’re looking for a way to forget about their problems. Similarly, if you see an increase in audience interaction on a Friday afternoon, it might be the ideal time to remind your followers about your weekend breakfast special.
4) Instagram stats: What you’ve posted
What it entails
Top-performing posts, Stories, IGTV videos, and promotions can all be found in the content sections of Instagram’s Insights. To match your content strategy with your overall Instagram goals, you can sort and filter content by category and interaction.
What you’ll notice
When you tap on “Posts,” you’ll see a grid of the content you’ve published to your feed over the course of a specified time span, sorted by interaction form.
You can filter and optimize your findings using the three menus at the top of the screen:
- Any form of post, including photographs, videos, and carousel posts
- Metrics: call button taps, comments, email button taps, likes, post interactions, profile visits, hit, saves, shares, text button taps, video views, and website taps
- Seven days, thirty days, three months, six months, a year, and two years are the time periods.
When you tap on “Stories,” you’ll see a grid of the Stories you’ve shared in a specific time span, sorted by interaction form. You can filter and refine your findings using two menus at the top of the page. You can choose from a number of metrics unique to Stories, such as next story, exits, and answers, as well as time periods, but only seven, 14, and 30 days are available. For a similar outlook with content type-specific metrics, tap on “IGTV videos” or “Reels.”
Why does it matter?
Content analytics aid in the creation of posts, Stories, Reels, IGTV images, and advertisements that raise brand awareness, drive interaction, and turn Instagram users into real-world customers. It also aids in determining which types of content are more likely to generate positive follower interactions.
Importantly, you can discover the types of content that best accomplish specific goals by sorting by interaction form. This gives you the ability to link your content development strategy to larger-scale business goals. Order posts by scope, for example, if you aim to raise brand awareness. What do the highest-ranking blogs have in common? What, however, do the posts with the shortest scope have in common?
Consider this scenario: you want to inspire your Instagram followers to read your weekly blog posts. Sort articles and stories by the number of times they were clicked on the website. What subject attracts the most visitors to your website? What is the most compelling call to action? Color scheme, for example, will influence whether a user clicks through to your profile and then to your website.
Finally, content analytics will help you plan your promotions. Determine if organic posts featuring clothing on a model in a studio perform better than those depicting clothing on a real customer in a real setting if you sell clothing, for example. Then, using this data, develop, schedule, and distribute high-impact promotions that are tailored to your target audience’s tastes.
c. Getting the right mix of analytics and spontaneity
Data does not exist in a vacuum, and it’s critical to understand the interdependencies among Instagram metrics. More engagement leads to increased scope, which leads to increased engagement. Similarly, posting at the right times increases reach, and curating the look and feel of your posts and captions increases views, comments, and shares.
Using analytics to improve the Instagram plan necessitates some (not so scientific) trial and error. You examine the data, develop a hypothesis, conduct your experiment, and analyze the results. Although these findings reveal insightful information about the audience’s interests and practices, they may also reveal nothing.
Instagram isn’t a completely sterile environment, and you can’t monitor every parameter. If a post that produced record-breaking engagement is replicated three or six months later, the results may not be the same. Remember that social media success necessitates authenticity. In content interaction, timeliness, creativity, and spontaneity all play important roles, so don’t be afraid to deviate from your analytics. When you do try something different, though, make sure you examine the data carefully. Making a mistake is bad enough, so making it repeatedly is much worse.
d. Additional Instagram stats
The above insights can be used by any company using Instagram to improve its content production and growth strategy. Instagram Shopping and Instagram Live are two other analytics outlets that are a little more specialized. The following analytics tips will help you get a massive advantage if you use these features.
Shopping analytics on Instagram
Keep track of which posts and items yield the greatest ROI if you use Instagram’s Shopping feature (you must have a business account to use this feature). Go to the “Content You Shared” section of Insights to see how your shopping posts are doing. To order the content by shopping-specific metrics, tap posts or Stories and use the menus. These options will only appear if Instagram Checkout is available on your account.
Alternatively, you can view post-specific shopping metrics by tapping “View Insights” under any shoppable post. Product button clicks and product page views are two examples. Keep an eye out for items that get a lot of page views but few clicks. This indicates that your product photos, descriptions, or pricing aren’t convincing enough to turn browsers into buyers. Change it up and revisit the conversion rate to see if it has changed.
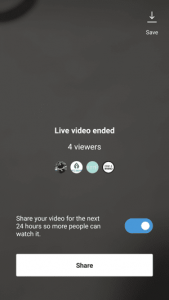
Instagram analytics for live video
Instagram Insights does not show live analytics and accessing actionable data related to live broadcasts is difficult. You can see how many people watched your Live in total, but this number will vanish as soon as your broadcast ends.